
Left rectangle ads redesigned


Robert Ripps book
History of Tribeca Buildings
CB1 has one of the lowest traffic fatality records in the city
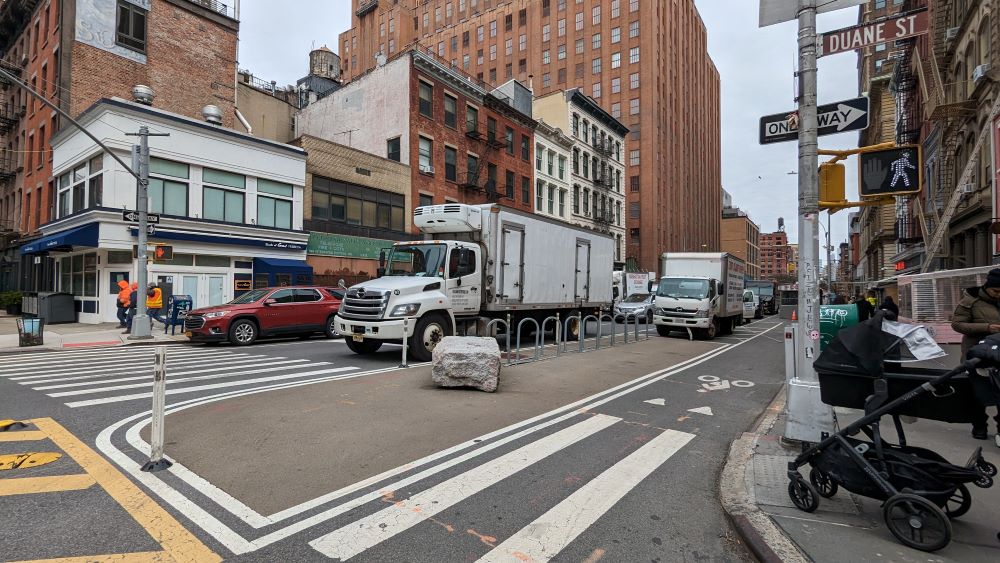
Community District 1 had zero traffic fatalities last year, a stat achieved by only seven other districts in the city — and I wanted to see if I could learn why. It’s sad to say that the absence of deaths is notable, but in this town, where 106 people were killed in traffic accidents last year, that’s where we are at. (Just for comparison, however, in 1990, traffic deaths were over 700, and half were pedestrians.)
The district (61,000 people) did have 77 total traffic injuries — 24 for pedestrians, 20 for bicyclists and 32 for motorists — in the year to date as of April 30. If you want to see the stats yourself, find them here.
So back to the “why,” the Department of Transportation noted that Tribeca and the rest of way Downtown have always been safer. “The 1st Precinct and other historic areas have long been amongst the safer parts of the city and DOT has also worked hard to redesign the streets, adding new protected bike lanes and other features that improve safety for all road users.”
It helps to have narrow, slow, winding streets, with low traffic, as Fidi and parts of Tribeca have. And since we are at the bottom of the island, there’s less thru-traffic than, say, Midtown. And the DOT has added a lot of safety improvement projects over recent years:
Calming traffic on Centre Street with a new protected bike lane
Protected bike lanes on Church Street
Protected bike lanes on West Broadway, Varick Street
Installation of painted pedestrian islands at various locations
Protected bike lane on Hudson Street
Protected bike lane on Broadway
Priority Corridors on West Street and Canal Street
There are also some corners that they describe as “daylighting,” where they move parked cars back from the corners so pedestrians are easier to spot by traffic. And they have installed 36 Leading Pedestrian Intervals (LPIs) — where pedestrians are given a head start at the crossings, and added 12 turn signals at lights.
And this has nothing to do with traffic, but I thought it was interesting to see these population stats that happened to be in the report:
Age Under 5 | 3,931 | 6.4 percent
Age 5-9 | 2,088 | 3.4 percent
Age 10-14 | 1,276 | 2 percent
Age 15-19 | 2,058 | 3.3 percent
Age 20-24 | 7,244 | 12 percent
Age 25-44 | 29,967 | 49 percent
Age 45-64 | 10,818 | 18 percent
Age 65+ | 3,596 | 6 percent
15 Comments
Comment:
Medium rectangle #1 (top)

Right column rectangle ads


Mega rectangle

Restaurant guide icon


Old Tribeca Scrapbook house ad


When 48 people not in vehicles are injured compared to 32 inside vehicles, I think we can be sure these are not all accidents. I think the language matters when there are so many road traffic incidents which are life changing in the worst possible way.
I am happy that nobody died on canal Street this year. That seems a remarkable outcome on that lawless stretch of road rage to our North
CB1 has some of the most dangerous traffic conditions in the entire city due to Holland Tunnel gridlock. Crossing Hudson or Canal at rush hour is so treacherous that everyone who lives here knows to simply avoid it if possible.
DOT and the mayor should be completely embarrassed by the pedestrian conditions they allow to exist on our residential streets. Nobody dying is literally the lowest bar possible.
Agree.
Agree completely. The crosswalks on Hudson Street approaching Canal and Canal intersection are constantly blocked by vehicles that view our neighborhood as a highway to/from the Holland Tunnel. The fact blocking the box is just tolerated by the NYPD in CB1 is so confusing and they seemingly have no answer to justify their complicity. Ask them why they don’t enforce it. They either ignore the question, blame the Port Authority, or reference historical precedent as some bizarre reason to allow blatant illegal behavior.
I also don’t know where you got the information about less thru-traffic down here as so much of the congestion in CB1 is absolutely thru-traffic passing thru our neighborhood to get to/from the Holland Tunnel and other parts of the city / NJ. All the weekend traffic that clogs our streets is just passing through.
The Protected bike lane on Hudson Street is not in Tribeca / CB1 but only starts in Hudson Square. Hudson below Canal remains purely for cars with little priority for pedestrians or cyclists.
The stats about traffic fatalities probably have more to do with lower population density down here vs anything the DOT or NYPD have done to make the streets around the tunnel safer.
Surprising error in your story: Total NYC traffic fatalities in 2023 were 262, not 106 as you stated.
My source is a recent Bloomberg News story by the fine reporter John Surico (https://www.bloomberg.com/news/features/2024-03-11/new-york-city-s-decade-long-battle-for-pedestrian-safety). It’s full of solid data (unlike your link, which went to an NYPD web page that didn’t present citywide numbers).
Long story short: compared to a decade ago — a more appropriate benchmark than your 1990, IMO — current (2023) NYC traffic-crash deaths are pretty much unchanged, though pedestrian fatalities, at least, are relatively low.
And yes, calling them “crashes” rather than “accidents” — a plaintive request of traffic-safety campaigners for a good 20 years — is a simple change in language that can go a long way.
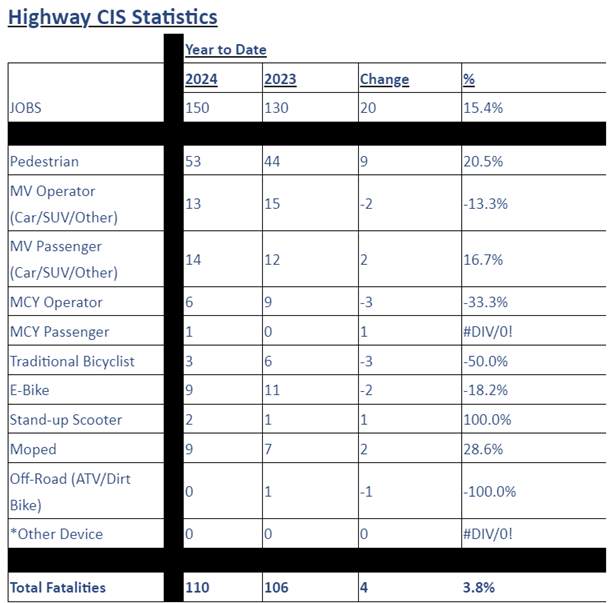
I am not going to use another newspaper as a source for data. If you click on any one of the patrol borough reports in that link I added, you will see the YTD 2023 total at the bottom of the chart. It says 106 on every one.
The Year-To-Date crash-fatality figures in the patrol borough reports you linked to are, as one would expect, only year to date — in this case, through 06/09/2024, as the note in the reports shows. They’re not full-year 2024 or 2023.
So to recap, total NYC traffic fatalities in 2023 were 262, not 106 as you stated. Please amend your post. Thank you.
The traffic from the West Side Highway up Canal street is unbelievable. Grid lock to the point people cannot cross the road. Cars drive the wrong way down the street coming from Washington on the north side of Canal to avoid circling around. I have seen strollers with children inside almost get hit. People speed through red lights without a care in the world. Start ticketing these reckless drivers before people are killed. That would solve some budgetary issues in the city while protecting our citizens.
All of north Tribeca is a mess because no one addresses and tickets the crazed drivers.
Following your link to Vision Zero stats, it is incredible to see the complete lack of any effort flagged for street design improvements on Hudson Street and adjacent streets in North Tribeca, especially compared to other areas of lower Manhattan. It is unquestionably one of the worst congested areas in the city and the NYPD exasperated the problem when it started restricting northbound traffic on West Street from turning right on Canal (apparently because of a pedestrian fatality) and changed driver behavior to start using Hubert or other lower Manhattan streets to just use Hudson Street to enter the tunnel or turn right on Canal instead. Diverting problematic traffic from one dangerous intersection to another is not really a strong vision zero plan. They just made a bad situation on Hudson Street worse and their plan is to seemingly hope nothing bad happens.
Hudson Street is used as an on ramp and off ramp to the Holland Tunnel, which is so poorly designed and managed but they are literally sticking to a street design from 1927 and have zero vision for improving safety and quality of life for residents.
The Neighborhood is pleading for basic help and yet this link shows that Tribeca is barely even on the radar for safety improvements. I think the neighborhood has been too nice when dealing with city officials. Someone should figure out how to sue the city to compel actual change. Maybe someone should report the situation on a holiday weekend at 7:01 PM when the traffic guards leave Canal Street intersection and the polite drivers are asked to obey the traffic rules on their own for the next several hours of remaining congestion.
Your NYPD link has Year to Date figures only. The 106 NYC crash-fatality figure you imputed to full-year 2023 was actually for this year through June 9, 2024, as a note in the NYPD table makes clear. My source’s 262 figure for 2023 citywide traffic fatalities is fully-documented. Please amend your post accordingly. Thanks.
Ok I will check with the NYPD.
I was right. You can look at the chart that the NYPD just sent me now. 106 deaths in 2023.
When I dive into that chart I see 112 traffic fatalities in 2023, close enough to what Pam says. But when I click further, on the upper left, I find there were also 30 bicyclist fatalities and 103 pedestrian fatalities, for a total of 245 deaths involved with traffic accidents. If I click on ALL , I see 265. Close to Charles’ total.
Discrepancies unexplained but not surprising in a city (?) document.
The Vision Zero link, which is what I found in Pam’s write-up, is:
https://vzv.nyc/
The link to Vision Zero’s fatality totals is:
https://vzv.nyc/