
Left rectangle ads redesigned

History of Tribeca Buildings
The latest covid tallies
It had been a while since I checked the infection rate in our zip codes, and seeing the state’s recent death totals, I thought I would also check ours. The city publishes the data here.
And then while I was at that, I checked the vaccination rates, also below. No shock that we are way above the national rate of 49 percent, but I was still surprised at the range between neighborhoods.
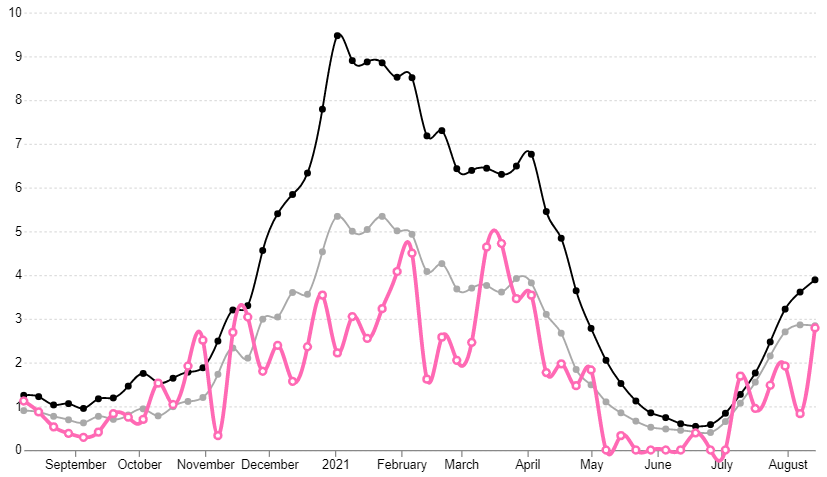
Our infection rate over the past 7 days is at 180 cases, or 2.79 percent. But that number has fluctuated over the past several weeks, from 0 in mid-July to now. See the chart below or the data here.
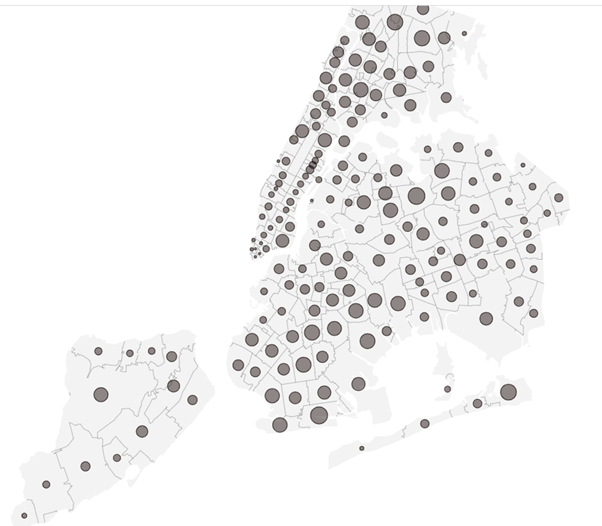
The death count, which is cumulative, is published here in both map and table form.
10007 | 5 (Tribeca)
10013 | 46 (Tribeca, Hudson Square, Soho, Little Italy)
10282 | 8 (BPC)
10280 | 7 (BPC)
10002 | 340 (Chinatown, LES)
10038 | 59 (Fidi, Chinatown)
10006 | 1 (Fidi)
10005 | 1 (Fidi)
10004 | 2 (Fidi)
The vaccination rates as of this week, for those with both doses:
10007 | 87 (Tribeca)
10013 | 77 (Tribeca, Hudson Square, Soho, Little Italy)
10282 | 62 (BPC)
10280 | 63 (BPC)
10002 | 74 (Chinatown, LES)
10038 | 72 (Fidi, Chinatown)
10006 | 100 (Fidi)
10005 | 82 (Fidi)
10004 | 100 (Fidi)

3 Comments
Comment:
Medium rectangle #1 (top)

Right column rectangle ads


Restaurant guide icon


Are children under age 12 included in the number of “residents”? That could skew the percentages. I don’t know the numbers but there seem to be a lot of kids in BPC and those are overall small zip codes!
I thought I had read earlier in the summer that the vaccination rate was over 90% for Tribeca/BPC….hard to understand these numbers if they are not specifying the age range.
You can look at the data yourself for the percentage if you think mine is off; it is of course changing.
The percentage is of eligible residents, which is ages 12 and over.