
Left rectangle ads redesigned

History of Tribeca Buildings

The Year in Crime
I last looked at these stats for the 1st Precinct was in August 2022, so while a year has not passed yet, I just watched a shirtless, clearly crazy man run up behind a guy on his way to lunch at Los Tacos and punch him at the base of his skull for no reason — the victim was just crossing Murray when it happened. He gave a brief chase and the perpetrator sort of scuttled off. I chatted with the victim and his friends for a minute — they were rattled, and the man was clearly hurt, but they decided to just get in line for lunch.
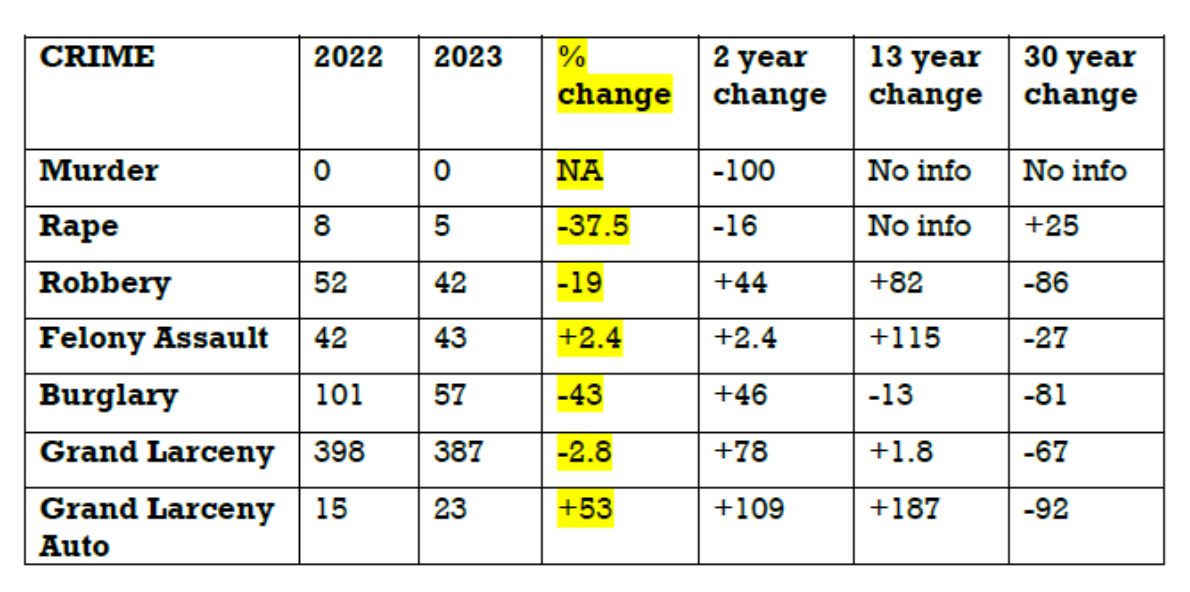
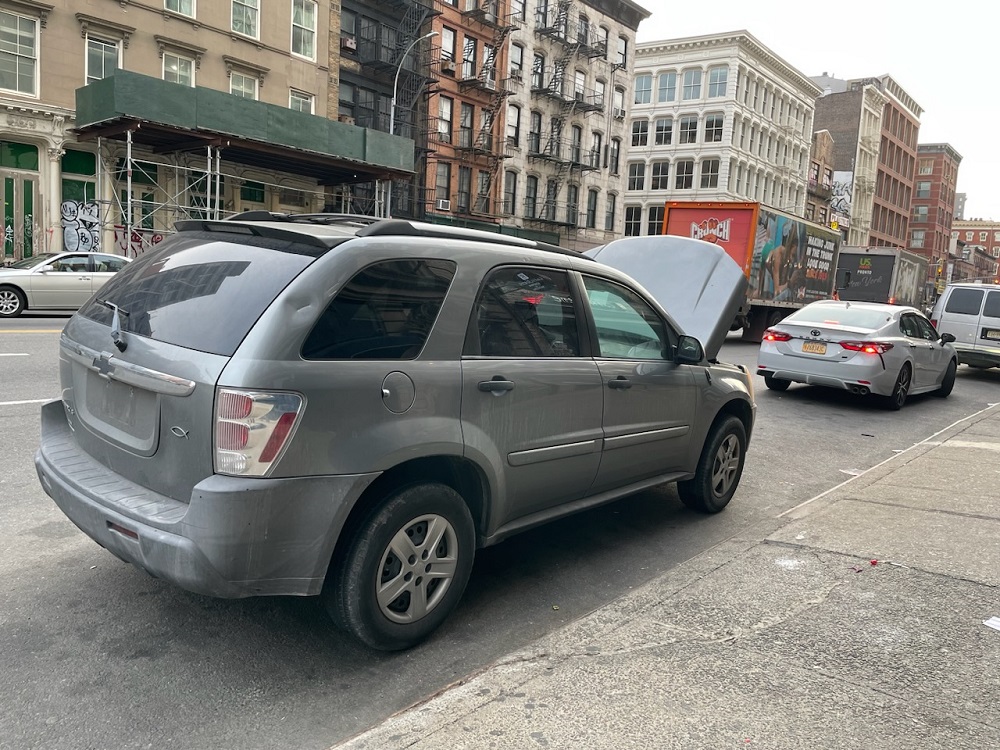
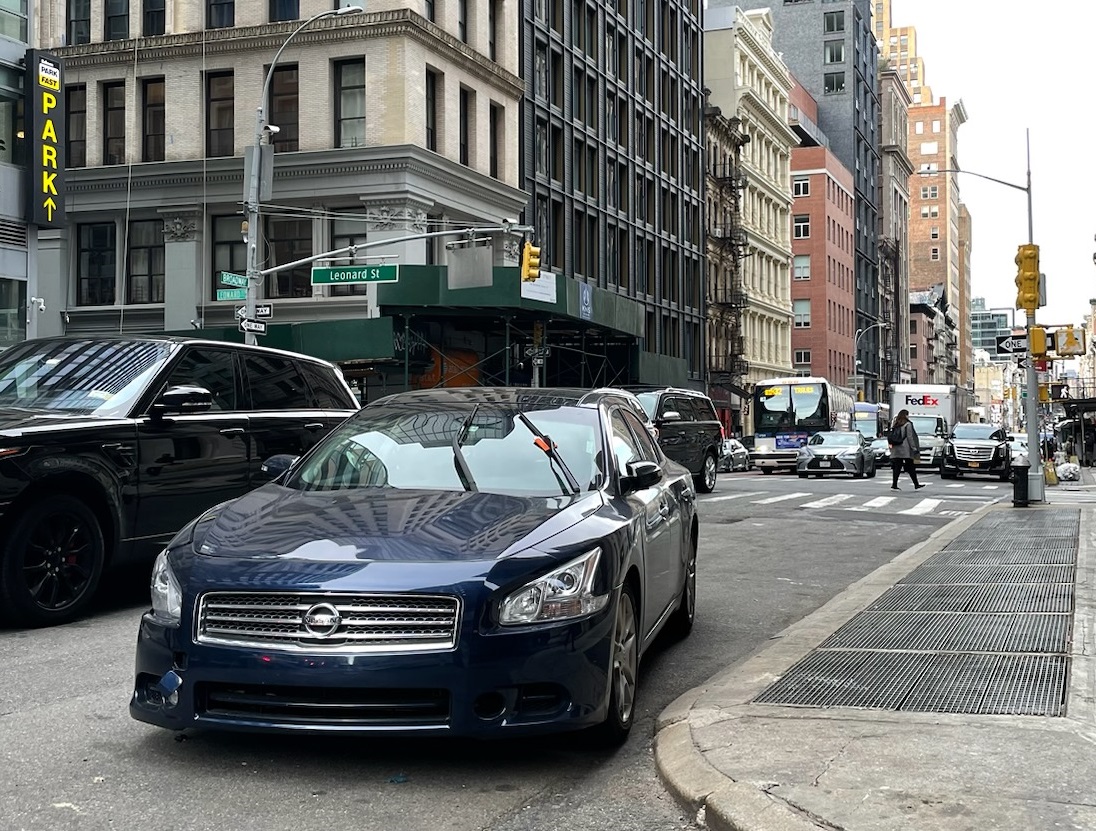
Overall, crime is down here in the district from this time last year by 9.6 percent, using year-to-date — a complete calendar year — numbers for this week in time. See the chart below, but the summary: all the categories are down EXCEPT for grand larceny auto, which is up by 53 percent and would explain why several readers have spotted abandoned cars on Canal. (After years of working in Riverdale, which has a huge GLA count, I know the signs: no plates, parts missing, close to a highway.)
Last year when I ran this a reader asked for the historical perspective and you can see the breakdown below and here are the overall stats
- Percent change over 2 years: +61
- Percent change over 13 years: +12
- Percent change over 30 years: -74
Someone can explain in comments what was happening around here in 1993…

6 Comments
Comment:
Medium rectangle #1 (top)

Right column rectangle ads


Mega rectangle

Restaurant guide icon


I think these are just 1st precinct stats(Not Manhattan or all of NYC) An expanded version here:
https://www.nyc.gov/assets/nypd/downloads/pdf/crime_statistics/cs-en-us-001pct.pdf
Also, from your description of the assault you witnessed in front of Los Tacos, I doesn’t seem like the victim ever received medical attention or reported it to the police.
I makes me wonder: how many assaults/thefts/burglaries go unreported?
Yes, 1st Precinct. I will clarify in the post. And yes, they didn’t want to call cops or have to deal with reporting it.
I have seen that second car on Canal there for weeks, and wondered why with no plates, clearly abandoned it is not removed or ticketed…
Ahh 1993. Rudy Giuliani was first elected in November 1993, which sort of tells the story. In terms of the 1st precinct, it’s also useful to remember that northern Tribeca was not primarily residential in those days, so very quiet nights and weekends (except where the printers were churning out red herrings for Wall Street on Hudson below Canal). And there was still a good bit of commercial closer to Chambers — Harry Wils & Co only moved off Duane St. in 1998. So property crime like grand larceny auto was likely much higher than now, as it was throughout the city.
While we are thankful for any reduction in crime year-to-year, we shouldn’t make the mistake of being “satisfied” when abnormally high rates are simply down from a year when they exploded, and nonetheless still high. Not needing to go back to the Giuliani onslaught to show reduced crime rates, let’s simply go back to 2019: pre Cuomo/DeBlasio/Bragg no-bail, shoplifters delight environment. Can we have a 2022 vs 2019 comparison?
Related to that, a year or so ago I understand the Captain of the 1st Precinct decided he no longer would issue “Police Blotter” statistics. You know, serious crimes, with descriptions: shop lifting at Target, muggings at local subway stops, certain streets and areas with an uptick of larceny and assaults, etc. Doesn’t democracy die in the darkness? If this is a fact, why would the NYPD administration not want the citizenry it’s sworn to protect not have the information needed to protect itself? Perhaps that lack of knowledge prevents prying eyes from asking why crime is at a certain level and not declining?
Might the Tribeca Citizen get some answers from the 1st????
I’ve never gotten the blotter from the 1st. I always go through DCPI. But I can ask!