
Left rectangle ads redesigned

History of Tribeca Buildings

The Year in Crime
I last looked at these stats for the 1st Precinct in May 2023, and before that, August 2022.
It seems a random act of violence is always my harsh reminder: last year, it was a crazy man who ran up behind a guy on his way to lunch at Los Tacos and punched him at the base of his skull for no reason. This year it was the worker in Bogardus Plaza who was slashed in the face as he was cleaning up the park.
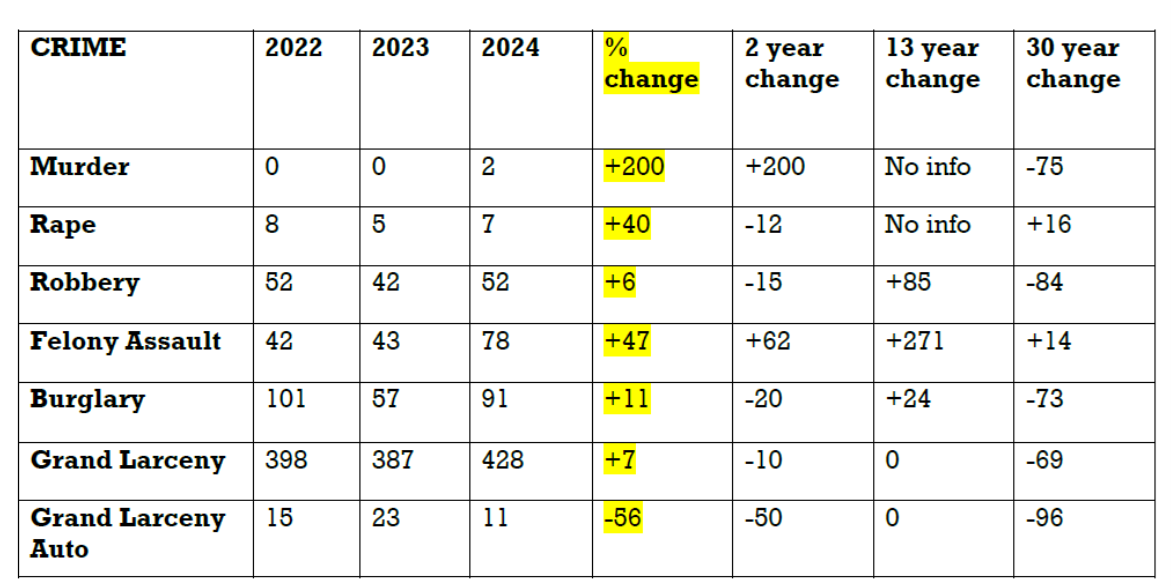
Overall crime is down here in the district from this time last year by .74 percent, using year-to-date — a complete calendar year — numbers for this week in time. See the chart above, but the summary: most categories are up — the most dramatic being Felony Assault, of which there were 78 in the district this year. You can review these yourself here.
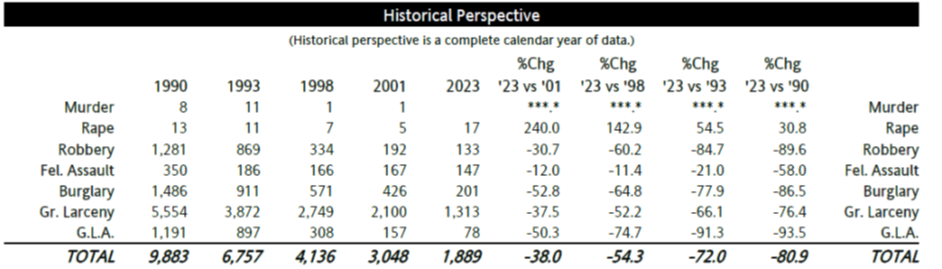
Recently an anonymous commenter said “when we moved to Tribeca in the late ’70s, the First Precinct had the lowest crime against individuals in all five boroughs. It was one of the many things that attracted us to the neighborhood. Where does the First Precinct rank now?” The NYPD’s data program, CompStat, does not go back that far, but here is the historical perspective; you can see those in the breakdown above, as well as the NYPD’s charts below:
- Percent change since 2001: -38
- Percent change since 1998: -54
- Percent change since 1993: -72
- Percent change since 1990: -81

3 Comments
Comment:
Medium rectangle #1 (top)

Right column rectangle ads

Restaurant guide icon


“The Year In Crime”
The percentage change numbers in your table are not correct.
I will double check…
i think the stats should be interpreted with a few things in mind:
because of lock-downs and increasing numbers of desperate and mentally ill people living on the street, 2020 – 2023 are not really normal years to compare the current levels against. the baseline should probably be 2019.
the current retail theft and petit larceny numbers are not accurate. the cops and the victims often see it as a waste of their time to file a report because the perpetrators aren’t prosecuted.