


Left rectangle ads redesigned

History of Tribeca Buildings
Congestion Pricing had no effect on air quality
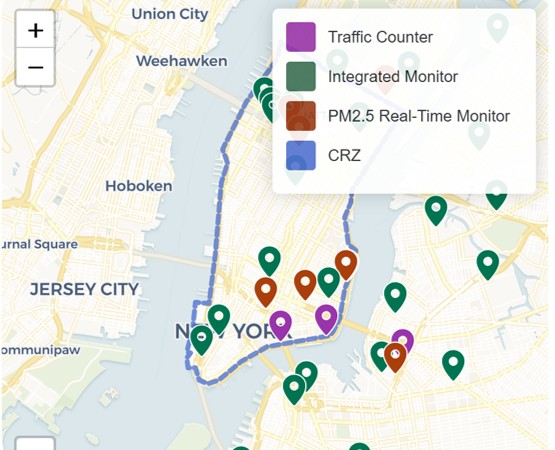
The city Department of Health just released a report to answer the question: Did congestion pricing affect air quality in the congestion relief zone?
The answer? No.
The city set up monitors around the five boroughs (there are two in Fidi) and Yonkers to measure four different pollutants: Fine particulate matter (PM2.5), nitrogen dioxide (NO2), nitric oxide (NO), and black carbon (BC). While all these pollutants are produced by vehicles, NO2 is considered the best indicator of traffic-related air pollution exposures. NO2, PM2.5, and BC can all have negative effects on health.
And while those pollutants have been on a steady decline for 20 years, fewer cars in the congestion relief zone did not play a part.
“The measured pollution levels were not significantly different than they would have been without the program,” the report reads, despite the fact that entries into the zone are down by 11 percent.
The report notes that there are a lot of factors at play: “many things impact air quality from year to year, such as average temperatures, rainfall, the presence of wildfires (both here and in other parts of the U.S. and Canada), the electrification of buildings and vehicles, the price of gasoline, and changes in regulations here and in other states. The study, as a result, could not just measure before and after; it studied the difference between the air quality levels measured after congestion pricing and estimates of what the air quality would have been if there were no congestion pricing.”
The report notes that traffic makes up only about 14 percent of PM2.5 emissions and 20 percent of NOx emissions. This means that a roughly 10 percent reduction in traffic volume in the congestion zone would not substantially change air pollution.
Congestion pricing started on January 5, 2025 — and around then this year these were the stats:
- 23.7 million fewer vehicles have entered the zone south of 60th Street than in 2024.
- Daily entries into the zone are down 12 percent — about 71,000 fewer vehicles per day.
- Commuter trips are down by as much as 21 minutes throughout the region.
- Bus speeds have increased, some routes as much as 25 percent.
- School buses are on time 72 percent of the time, up from 58 percent last year.
All these stats were compiled by Congestion Pricing Now, an advocacy coalition that includes non-profits (Environmental Defense Fund, New York Lawyers for Public Interest, Trust for Public Land, Transportation Alternatives), wonky types (Citizens Budget Commission, Hudson Square BID), developers (Two Trees) and corporations (Lyft, Sam Schwartz Engineering) among many others.
They got their data from the MTA, Bloomberg, the Regional Plan Association and about 10 other sources.
And there’s more. Crossings entering the zone during morning commutes are faster on average:
- Holland Tunnel is 36 percent faster
- Lincoln Tunnel is 10 percent faster
- Queensboro Bridge is 21 percent faster
- Williamsburg Bridge is 23 percent faster
Tribecan Charlie Komanoff had a more nuanced analysis in Vital City, where he noted that revenues are close to what was predicted (not quite $50 million per month vs. $60 million per month predicted) but a bit off, and that travel speeds have not increased.
“According to MTA figures, monthly revenues minus expenses are struggling to reach $50 million. As for traffic flow, the early euphoria of freer-flowing streets has dissipated. While some rebound in traffic was expected, data culled from Ubers and yellow cabs in motion suggest that travel speeds within the zone today are barely surpassing those from a year earlier.”
8 Comments
Comment:
Medium rectangle #1 (top)

Right column rectangle ads


Restaurant guide icon

This study seems half baked. While it’s good news that no significant increase was detected at the areas outside of CRZ, it makes no sense that they didn’t put air quality monitors around the Holland Tunnel within the CRZ, which apparently has had the most significant increase in travel speeds (potentially reflecting reduced traffic/pollution).
I’m also skeptical that 12 measurements locations across the entire CRZ is enough to come up with a statistically significant sample given the complex dynamics at play (wildfire smoke, rainfall, etc.)
It seems they focused mainly on the non-CRZ communities since they made noise about this being a potential issue.
Missed opportunity from NYC/MTA given Tribeca has some of the worst air quality in the area. They should’ve known to measure here.
Just curious…what is your source for asserting Tribeca has some of the worst air quality in the area?
https://a816-dohbesp.nyc.gov/IndicatorPublic/data-features/neighborhood-air-quality/
SHOCKER! The government sold us a lie?? Not only has this done nothing for air quality, it’s also done nothing for congestion – it’s just another tax!
Indeed
Nah, I cross Hudson & Beach almost every weekday near(ish) to rush hour. Before congestion pricing cars heading for the Holland Tunnel would routinely be backed up for blocks. Now that sort of thing is extremely rare. It’s definitely made a difference.
All this city cares about is money. Congestion pricing was supposed to help the Mismanaged Teansit Authority. Meanwhile 24/7 there are problems on the trains and innocent people continue to be victims of crimes.
Fewer vehicles = better air.
I’ve been thrilled at the greater calm, too!
NYC keep on finding solutions:)